



AZ · 13 cities
Dangerous neighborhoods in Arizona
Arizona recorded 385 violent crimes per 100,000 residents in 2025, 1.2 times the national rate and down 15% since 2022. Of the 13 cities we cover, Phoenix, Glendale and Mesa have the highest rates and Surprise the lowest. Each guide breaks down the specific blocks, transit points and hours where a little more attention pays off.
 Phoenix
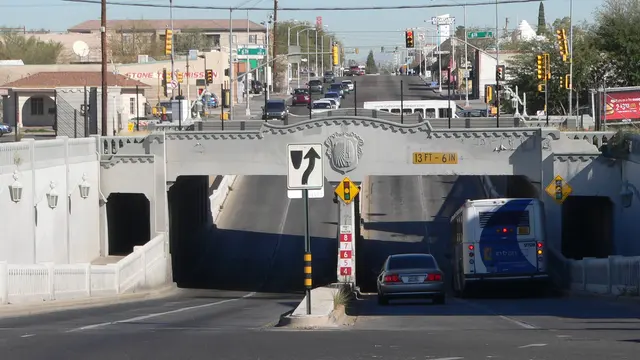 Tucson
 Mesa
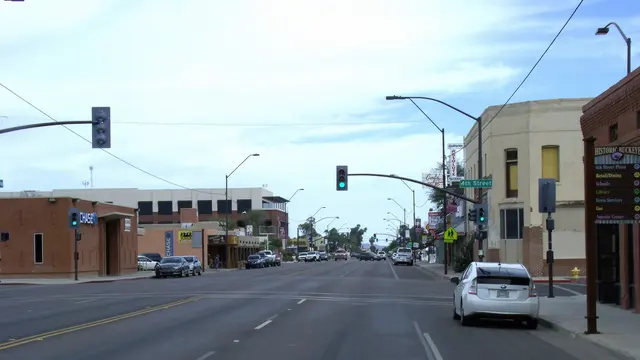 Buckeye
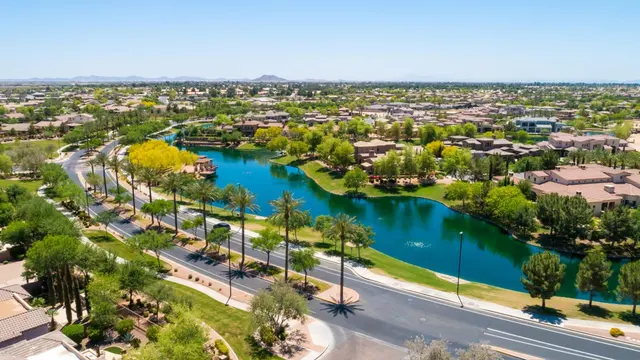 Chandler
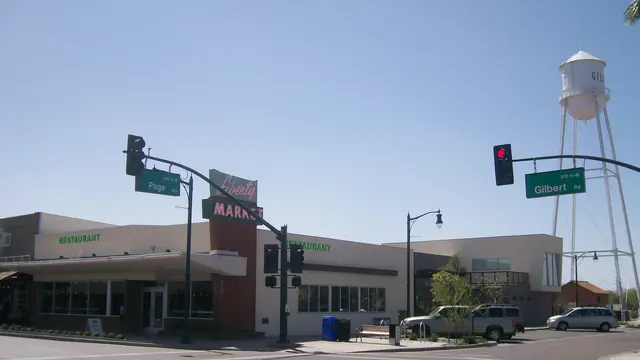 Gilbert
 Glendale
 Goodyear
 Peoria
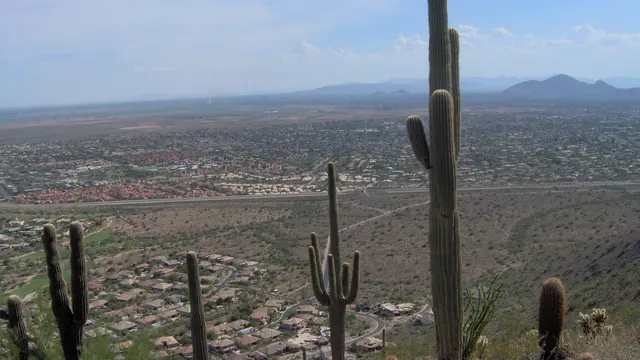 Scottsdale
 Surprise
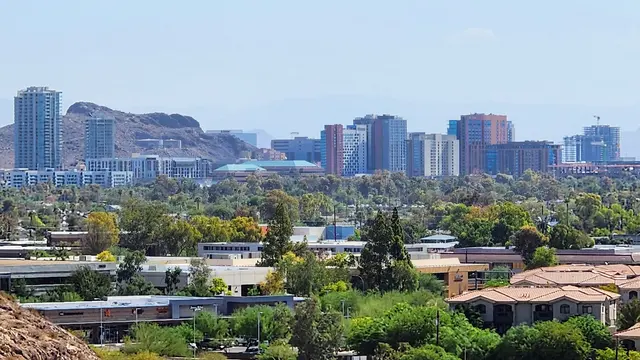 Tempe
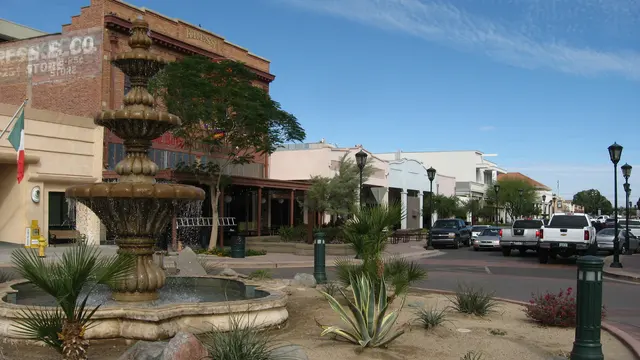 Yuma
FBI data · 2025
Most dangerous cities in Arizona, ranked
The 12 Arizona cities we cover, ordered by their official violent crime rate: murders, rapes, robberies and aggravated assaults per 100,000 residents. 4 of 12 run above the state average of 385. A high citywide rate doesn't make a whole city unsafe: crime clusters in a few areas, and each guide above shows where.
- 1
Phoenix
697 violent crimes per 100k
1.8× the state average
- 2
Glendale
438 violent crimes per 100k
near the state average
- 3
Mesa
425 violent crimes per 100k
near the state average
| # | City | Violent per 100k | Property per 100k | Population |
|---|---|---|---|---|
| 1 | Phoenix | 697 | 2,052 | 1,688,662 |
| 2 | Glendale | 438 | 2,354 | 260,498 |
| 3 | Mesa | 425 | 1,306 | 519,990 |
| 4 | Tempe | 418 | 2,702 | 191,348 |
| 5 | Yuma | 353 | 1,153 | 105,175 |
| 6 | Peoria | 253 | 1,091 | 201,962 |
| 7 | Goodyear | 236 | 1,364 | 123,911 |
| 8 | Scottsdale | 175 | 1,753 | 247,258 |
| 9 | Buckeye | 159 | 755 | 120,174 |
| 10 | Chandler | 124 | 1,231 | 282,191 |
| 11 | Gilbert | 117 | 878 | 293,851 |
| 12 | Surprise2024 | 109 | 781 | 163,202 |
| Arizona average | 385 | 1,543 | ||
| US average | 330 |
Safest cities in Arizona we cover
At the other end of the list, these have the lowest violent crime rates of the 12 cities in this ranking.
- Surprise109 per 100k · 75% below the state average
- Gilbert117 per 100k · 70% below the state average
- Chandler124 per 100k · 68% below the state average
Source: FBI Crime Data Explorer, offenses reported by each city's police department per 100,000 residents; most cities use 2025 data, and a small year next to a name marks a different latest complete year. Only cities with a neighborhood guide are included, and years with incomplete reporting are left out. Not enough reliable data to rank: Tucson. How we rank cities.
Arizona crime: frequently asked questions
What is the most dangerous city in Arizona?
Of the 12 Arizona cities in our ranking, Phoenix has the highest violent crime rate: 697 offenses per 100,000 residents in 2025, 1.8 times the state average. Glendale and Mesa come next. Even in Phoenix, crime is concentrated in a few areas, and our Phoenix guide shows which ones.
What is the safest city in Arizona?
Among the cities we rank, Surprise has the lowest violent crime rate, at 109 per 100,000 residents in 2024, 75% below the state average. Gilbert follows with 117. A low citywide rate doesn't mean every block is the same, but day-to-day risk is lower.
Is Arizona safe to visit?
Most visits go without trouble, but Arizona has more violent crime than the US as a whole. Arizona recorded 385 violent crimes per 100,000 residents in 2025, 1.2 times the national rate of 330. Crime is concentrated in specific neighborhoods and hours rather than spread evenly, so knowing where those areas are matters more than the statewide figure; our 13 city guides cover them block by block.
Which Arizona cities have above-average crime?
4 of the 12 cities we rank have a violent crime rate above the Arizona average of 385 per 100,000 residents: Phoenix, Glendale, Mesa and Tempe. The other 8 are below it.
Is crime going up or down in Arizona?
Violent crime in Arizona went from 451 offenses per 100,000 residents in 2022 to 385 in 2025, down 15%. Property crime went from 2,150 to 1,543 over 2022–2025, down 28%.
Where do these crime figures come from?
From the FBI Crime Data Explorer, which collects the offenses reported by each police department. Rates are offenses per 100,000 residents, so cities of different sizes can be compared, and years with incomplete reporting are left out. Our methodology explains the details.